Home broadband usage driven by TV streaming
Evidence is emerging of what applications are driving home broadband usage at the Davies house.
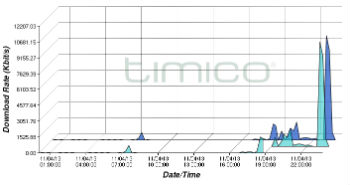
 The two graphs presented herein for your entertainment and delight are of the broadband traffic over our Timico 80/20 FTTC line at home over the last two days – Tuesday and Wednesday.
The first graph shows very little happening during the day. As it happens my wife Anne was at work – she is a supply teacher. There isn’t that much going on in the evening either really although were were hitting 10Mbps at 10.30 pm.
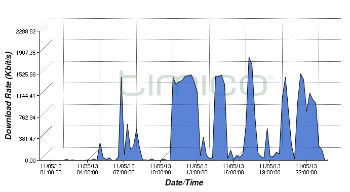
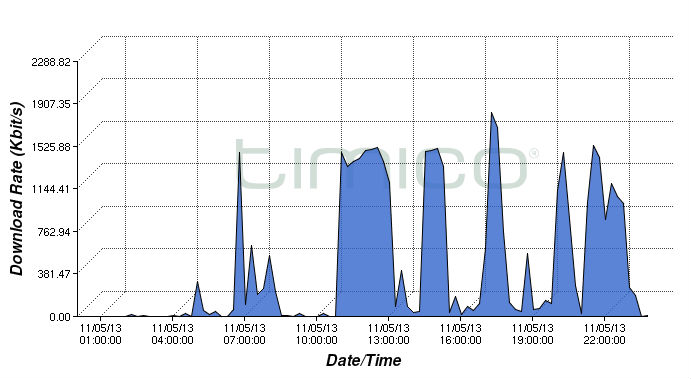
 The second graph shows the traffic when Anne was at home during the day. What a difference!
Most of the bursts are running at around 1.2Mbps and lasting between 30 minutes and two hours.
Now I happen to know that Anne, who always keeps herself busy, often has cookery programmes on during the day in the kitchen. There is so much to catch up on – Master Chef, Great British Bakeoff etc etc. She plays them on her iPad.
The bursts of traffic look very much as if they represent this kind of TV programme watching. Also interesting is the bandwidth required. It isn’t very much although I’m not sure what codecs were being used by iPlayer.
The other usage must basically represent everything else though the spike at 10.30 looks like a download – I know not what. All this just goes to show what this tinterweb thing is being used for. This is in no way an accusation that Anne sit around all day doing nothing – if you knew her you would know she is a very active person. I would however say that she was very representative of the average consumer even if I am not.
You can check out our home broadband data usage trend here.
Ciao bebe…

