Categories
Business voip hardware

Time of Day traffic and the Patterns of Life by Colin Duffy

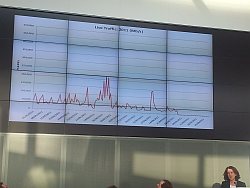
This is a Time of Day telephony traffic graph – I’ve been looking at them for most of my working life. For a normal business day they pretty much always look like this:


This is how business people use telephones on a normal working day.

They generally get into the office and start making calls at about 9am, work steadily up to about midday, then have a spot of lunch. They come back at 2pm and start calling again, then everything starts tailing off about 4pm as people start thinking of home – or beer, or both.

Telephone exchanges have to be built to cope with the traffic at the busiest hour of the day so since the very earliest days of telecommunications telephone companies have been trying to reduce the height of those peaks and spread the load more evenly.

A call at a peaks adds a cost but a call either side of a peak adds a profit.

As you can see, the network is doing practically nothing after 6pm

Categories
broadband Engineer

Evidence that video is driving home internet use

Home broadband usage driven by TV streaming

Evidence is emerging of what applications are driving home broadband usage at the Davies house.

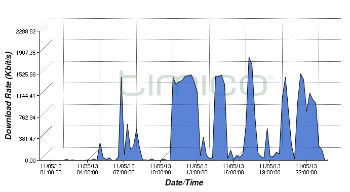
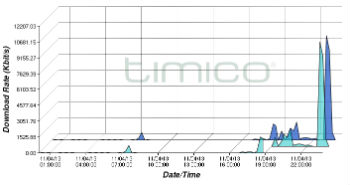
broadband usage wife at workThe two graphs presented herein for your entertainment and delight are of the broadband traffic over our Timico 80/20 FTTC line at home over the last two days – Tuesday and Wednesday.

The first graph shows very little happening during the day. As it happens my wife Anne was at work – she is a supply teacher. There isn’t that much going on in the evening either really although were were hitting 10Mbps at 10.30 pm.

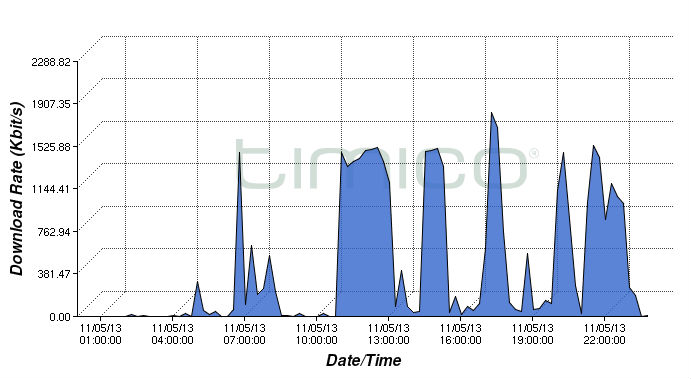
DSL usage wife homeThe second graph shows the traffic when Anne was at home during the day. What a difference!

Most of the bursts are running at around 1.2Mbps and lasting between 30 minutes and two hours.

Now I happen to know that Anne, who always keeps herself busy, often has cookery programmes on during the day in the kitchen. There is so much to catch up on – Master Chef, Great British Bakeoff etc etc. She plays them on her iPad.

The bursts of traffic look very much as if they represent this kind of TV programme watching. Also interesting is the bandwidth required. It isn’t very much although I’m not sure what codecs were being used by iPlayer.

The other usage must basically represent everything else though the spike at 10.30 looks like a download – I know not what. All this just goes to show what this tinterweb thing is being used for. This is in no way an accusation that Anne sit around all day doing nothing – if you knew her you would know she is a very active person. I would however say that she was very representative of the average consumer even if I am not.

You can check out our home broadband data usage trend here.

Ciao bebe…

Categories
Engineer media

29% of USA ISP traffic is Netflix

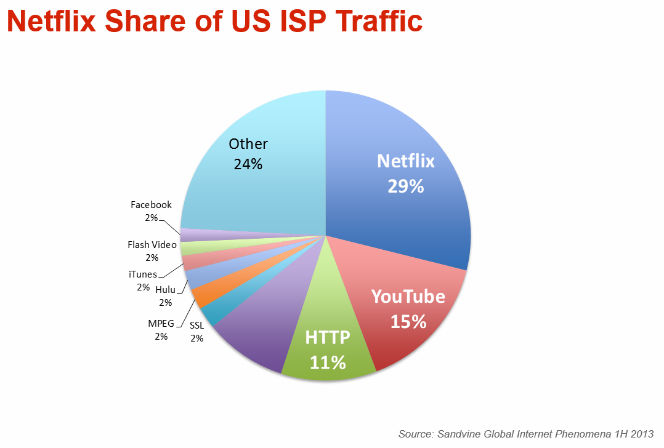
Interesting talk from Nina Bargisen of Netflix. What surprised me was the chart she showed of the main traffic drivers on ISP networks in the USA. Netflix comes out top, representing 29% of all traffic carried by ISPs in the US. YouTube is only 15% of traffic with http coming third at 11%.

The thing to consider here is that as people move to higher quality video -3D,  Super HD, Ultra HD (4k) and ultimately 8k format the percentage of traffic that is video is clearly going to grow. Also clear is that this move to higher bandwidth video is going to seriously drive bandwidth requirements – both in operator networks and at the home broadband level.

Netflix recommend that you need 12Mbps bandwidth to carry 3D and between 5 and 7 (optimally) for Super HD. In the UK you would therefore be able to stream one 3D video or two Super HD, assuming an average download bandwidth of 14Mbps. 4k video will need 15Mbps per stream.

If for the sake of argument we assume that Netflix and YouTube represent all the video traffic in the USA then as 4k comes on stream and the bandwidth required to support it therefore doubles then video could well end up at almost 90% of all internet traffic. I realise that other applications will also grow their bandwidth needs but I don’t think I’m a million miles off the mark.

It’s coming folks. Better get your broadband speeded up. Pic below is of the chart shown by Nina at the conference.

PS no idea why people watch TV – the only good stuff on is Time Team and Storage Hunters and I’ve already seen Mary Poppins quite a few times.

USA ISP traffic statschart courtesy of Netflix and Sandvine


Categories
Engineer internet

iOS7 release causes internet traffic to double

traffic growth on lonap network due to ios7 upgradeiOS7 caused a stir in more than one way last week. Twitter abounded with all sorts of comments regarding how slow the Apple servers were responding to download requests from excited fanbois eager to checkout the latest slightly iterative functionality of their new iOS. When the dust settled it seemed that the majority of people had been sorted.

Taking a look at the effect of iOS7 on networks comes up with some interesting results. The graph in the header pic above shows the traffic over the Lonap core before, during and after the flurry wave (ocean?) of downloading. Steady state is around 30Gbps or maybe slightly more. Once iOS started to hit the fan this doubled to around 60Gbps.

It’s good that networks such as Lonap can take the capacity hit.

The growth in traffic comes as no surprise when you consider the size of the download. This seems to have ranged from around 700MB to nearly a Gig depending on the device with 3GB of space needed on your phone for the install. I guess you wouldn’t want to be eating into your mobile data bundle with that.

Categories
Engineer internet ipv6

A few observations on the Cisco Annual VNI Report 2012 – 2017

Trefor Davies thumbnail pictureI live in my own little world. It’s a connected world but relatively contained. I have a modest 2,461 followers on Twitter, 455 friends on Facebook and over 5001 connections of LinkedIn.

All this comes in to perspective when you read Cisco’s annual Visual Networking Index, a body of research that charts the growth of the internet and forecasts traffic patterns over the next five years. The latest issue is just out and comes with a ton of data. I’ve distilled a few points that jumped out of the router at me and shared them below.

Connected people and IPv6

According to the forecast by 2017 3.6 billion people will be connected to the Internet, up from 2.3 billion in 2012. Also by 2017 there will be 19 billion networked devices, up from 12 billion last year.

That’s a lot of people and a lot of devices. The fact that there are around 5 times more devices than people is a reflection of the growth of machine to machine connectivity. Nobody is going to be carrying around five networked devices, although having said that I carry four but don’t use me as an example of Mr Average.

It’s interesting to note that the number of IPv6 connected devices is forecast to grow from 1.6 billion in 2012 to 8 billion in 2017. On the face of it this suggests that most of the growth in connected devices is going to come from IPv6 which shouldn’t come as a surprise.

Metro versus long haul

Cisco reckons that metro traffic will surpass long haul traffic in 2014 and will account for 58% of total IP traffic by 2017 and will grow nearly twice as fast as long-haul traffic from 2012 to 2017. This is not something that your average man in the street will have to think about but it does help us to understand the trend towards regional peering exchanges.

Historically most ISPs connect to the internet at a few major hubs. London is one such hub. However as more and more traffic is local traffic it makes more sense to connect this traffic near to where it originates. For example the traffic between two servers “taking to each other” in Leeds would historically have been tromboned to London and back. It obviously doesn’t make sense to pay to cart data hundreds of miles and back if it can be done more directly. Now ISPs with a reasonable density of customers in Leeds can connect via the IX Leeds Peering exchange. The same applies for Manchester. In time as traffic levels grow the business case for smaller metropolitan areas will work we will see other locations appear on the connected map.

WiFI/mobile

Wi-Fi and mobile-connected devices will generate 68% of Internet traffic by 2017. It wouldn’t surprise me to see this number upsided. The only fixed internet connections in our house are the Xbox and my home office VoIP phone and the XBox is likely to go wireless when the new one comes out later this year. I would guess that most wired internet connectivity is going to be business based.

There’s more info on the Cisco blog here together with links to tools that allow you to play with the numbers. It’s well worth a browse.

Returning to my opening lines and the number of people I connect with, all these statistics do highlight the changing nature of our world. We are going to have to continue to adapt as more and more of our daily lives become electronic and connected.

I think these are exciting times from both a personal and business perspective. Exciting because of the wave of change sweeping across our personal lives that will hopefully enrich and enhance the quality of our lives. Exciting from a business perspective because there is money to be made out of all this growth.

That’s all folks…

1 no idea actually how many because it only tells me 500+ and I couldn’t figure out how many and I wasn’t prepared to spend any time finding out how to do it.
Categories
Engineer fun stuff internet

TalkTalk break records for downloads with 557GB per sec on New Year’s Day

Trefor DaviesTalkTalk is a highly successful provider of communications services – broadband, phone lines etc. I noted an entry in the Twitter stream this morning that showed they had seen record traffic levels on New Year’s Day – people upgrading firmware on new gadgets, using the gadgets etc.

We know this because TalkTalk CTO Clive Dorsman blogged about their network peaking at 557GB per second of traffic – that’s around 4.45Terabits per second which is impressively massive and three times to peak usage seen on the LINX network. I can only dream of having that amount of capacity at Timico.

Clive goes on to sell TalkTalk broadband services in his post. That’s OK. I occasionally chuck in a reference to a Timico service (great value & service etc – check it out here). “TalkTalk Superfast Fibre Broadband … costs £10 per month for up to 38MB or £15 for up to 76MB, allowing downloads up to eight times faster than the UK average.”

The only tiny element of doubt I have about all this is that I don’t believe that FTTC speeds of 76 Megabytes are available. In fact the TalkTalk product pages correctly quote speeds of 76 Megabits per second.

I suspect that Clive’s post was written by a PR person new to the tech game. I guess these things happen. I’m sure we are all guilty of the occasional cock up.

Btw this is only a bit of fun but I attach a screenshot of the post here for reference in anticipation of the corrections to the TalkTalk blog and the pursuant challenge for me to provide evidence. Also if the real number is 4.45Terabits per second – as I said that is massively impressive.

Categories
Engineer olympics

Olympic bandwidth usage growth

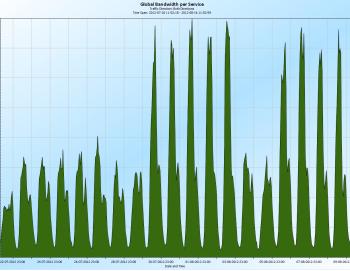
chart showing  http (web browsing) traffic before and during the OlympicsThought this would interest you. It’s a chart showing the http traffic on our broadband network in the run up to and during the London 2012 Olympics.

The change is quite amazing. This growth isn’t representative of all the internet traffic during that time – that showed an overall increase of 30% or so.

As a business ISP our peak traffic time is during the day with a smaller local maximum (ok mini peak) in the evening when homeworkers and road warriors get back and use their work-provided broadband.

We still saw the evening  mini peaks but they are dwarfed by the daytime ones.

That’s all folks…

Categories
Engineer mobile connectivity

Growth in traffic over O2 3G data network between 2008 and 2011

growth in O2 3G traffic correlated with device intro milestonesThis chart is a few months old now but I haven’t had it all that long and is still interesting to take a look at (click either pic to enlarge).Growth in traffic over O2 3G network between 2008 and 2011

It shows the growth in O2 3G data traffic between 2008 and 2011. See the spike when the iPad was introduced combined with the football world cup traffic (dunno why anyone bothers!).

I don’t have an up to date one which would probably be even more interesting but I suspect that is too close for commercial comfort.

Over the next few weeks I’m going to be covering two main themes. These are the Olympics Games and 4G. They are different though to some extent the technical aspects are very similar. Both subjects are going to be in our consciousness quite considerably from here on.

I’m not going to be blogging or tweeting over the Easter Holidays so see you all back on the 16th April, thoroughly refreshed and ready for the sensory onslaught that will be the run-in to London2012.

PS Thanks to O2 for the chart – keep the info coming guys – everyone is interested 🙂


Categories
Apps Engineer media olympics

2012 – Summer of Sports on Steroids – BBC estimates more than 2x Football World Cup traffic levels

growth in BBC iPlayer coverage of Olympics2012 or as the BBC puts it “Summer of Sports on Steroids” 1 is going to be another milestone year for the ISP industry with the UK playing host to the Olympic games and another record anticipated for internet traffic levels. On Wednesday at the ISPA conference we had Jane Weedon, Controller of Business Development at the BBC talking about their preparations for the games.

The coverage in 2012 is going to be comprehensive with pretty much 100% of the sport available to watch as it happens – up to 27 simultaneous channels at the peak towards the end of the second week. This will have grown from perhaps 15-20% of coverage at the Sydney games 35% in Athens and 65% in Beijing (click on the header photo for graphic illustration).

The peak traffic during the South Africa Football World Cup hit 450Gbps with everyone going online to watch the EnglandiPlayer traffic levels during Football World Cup v Slovenia match. For perspective this year so far iPlayer traffic has peaked atiplayer traffic levels in 2011 220Gbps.

So look out ISPs.

The forecasting of traffic levels for these games is in reality going to be very difficult. On the higher demand side the games are on home territory and will appeal to a wider demographic than the Football World Cup. To counter this device proliferation may lead to the streaming being distributed over a wider range of media – 3G mobiles and tablets, public WiFi zones, offices providing big TV screens and the fact that many folk may well take the two weeks of the games off on holiday.

Medals success for Team GB is also going to be an influencing factor.

The Beeb has gone into significant detail in estimating demand on a session by session basis and has come up with a forecast of  10 x the traffic levels for London as they saw in Beijing. That’s 1Terabits a second 2  at the peak in streams averaging 1Mbps.

That’s enough Olympic bits for the moment but there is so much interest in this subject looking ahead I’m going  to be looking out for more Olympic stories to share.

1 Steroids is perhaps an unfortunate word to use in this context

2  Nobody is going to hold them to this forecast but it certainly gives us all an indication of what to expect